
Here is the second post of the series on basic network troubleshooting and tools under RHEL / CentOS.
In this post, I will talk about the Linux mtr command.
Other posts of the series
This post is part of a series of Linux Networking tips and tricks.
The other posts of this series are:
Ping and traceroute for basic network troubleshooting
We all know the ping and traceroute commands to make the basic network debugging tasks from a host.
For example, if we use a down-up method to troubleshoot connectivity to a remote host:
- Can we ping our own IP address? – To check if our own IP is correct and if the interface is up. A basic layer-1 test.
- Can we ping another host on the same network? – To check the layer-2 part.
- Can we ping our gateway? – To check the layer-3 part of our local network.
- Can we ping the destination on another network? – To check if the routing to the destination is working, and to also have an idea of the RTT and packet lost ratio.
- Then, we make a traceroute to see the path we use to reach this destination? – To see the routing path and hops to this destination.
In replacement of steps 4 and 5 above, we can use the mtr command.
The mtr command: My TraceRoute
My traceroute, originally named Matt’s traceroute (MTR) combines the functionalities of a ping, to measure latency, jitter, packet loss, and a traceroute, to see the path and number of hops between the sender and destination, in the same tool. It allows you to constantly poll a remote host and see how the latency, packet lost ratio, and jitter changes over time.
Note: MTR is not only available on Linux, but also on Windows (winMTR) and on Mac.
How does it work?
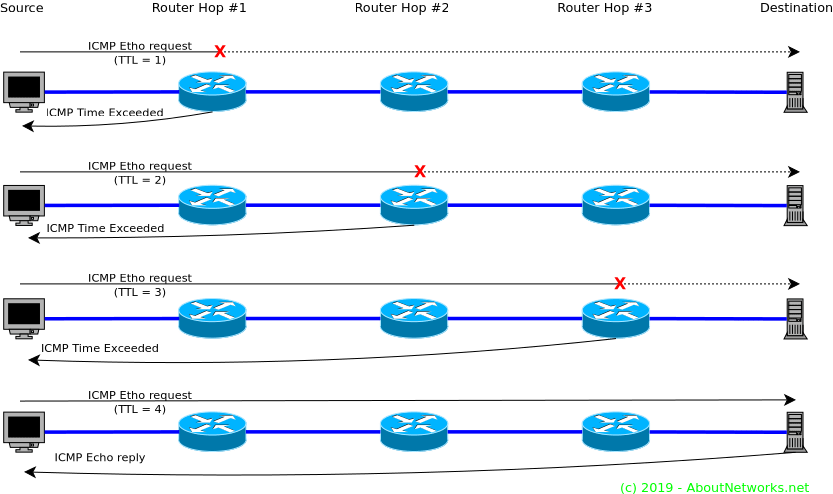
As with other traceroute tools, mtr relies on ICMP Time Exceeded packets coming back from the transit hops/routers, by sending ICMP Echo request packets with the time to live (TTL) field increasing by one for each request. Then, it uses the characteristics of the answers (time, time difference between packets, packet lost or not, etc.) to build the output statistics.
As we will see below, mtr also has a UDP and TCP mode that sends UDP or TCP packets on the port destination we choose, with the TTL field in the IP header increasing by one for each probe sent, toward the destination. When the UDP or TCP mode is used, MTR relies on ICMP port unreachable packets when the destination is reached.
Basic use of mtr
Default use
Without any argument, the mtr command displays hostnames in the interactive interface and runs until you type q.
Example:
$ mtr 8.8.8.8

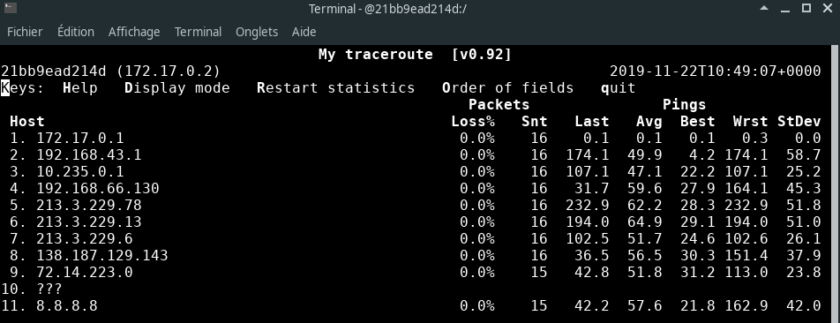
Display Numeric IP addresses
By using the -n option, mtr displays the numeric IP addresses instead of the hostnames.
$ mtr 8.8.8.8 -n
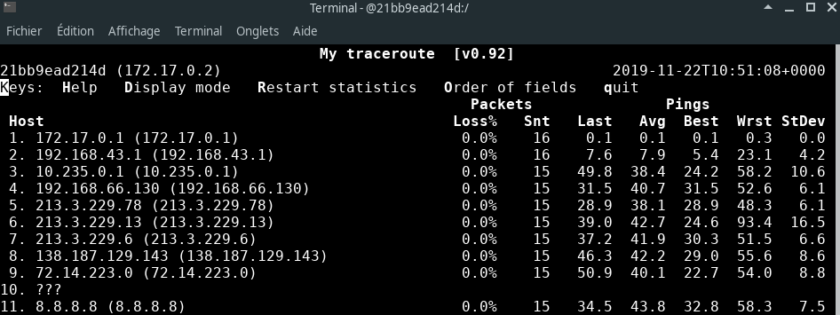
Display hostnames and numeric IP addresses
By using the -b option, mtr displays both the numeric IP addresses and hostnames.
$ mtr 8.8.8.8 -b
More advanced use of mtr
Report or report-wide mode
If you don’t want to use the interactive interface, a bit painful to copy/paste the results into a report (or blog like here), you can use the report or report-wide mode.
By default, the report mode (-r) or report-wide (-w) make a test with 10 packets and give you a nice output:
$ mtr 8.8.8.8 -r
HOST: 21bb9ead214d                Loss%   Snt   Last   Avg  Best  Wrst StDev
  1.|-- _gateway                   0.0%    10    0.1   0.1   0.1   0.1   0.0
  2.|-- 192.168.43.1               0.0%    10    7.3  14.9   5.3  48.0  14.1
  3.|-- 10.235.0.1                 0.0%    10   37.7  98.6  34.2 171.4  55.6
  4.|-- 192.168.66.130             0.0%    10   49.2  73.8  35.9 141.1  36.5
  5.|-- 213.3.229.78               0.0%    10   58.5  84.8  28.7 164.9  54.7
  6.|-- 213.3.229.13               0.0%    10   52.4  81.5  41.3 161.1  41.4
  7.|-- 213.3.229.6                0.0%    10   41.2  64.0  31.9 138.6  40.2
  8.|-- 138.187.129.143            0.0%    10   40.5  96.2  40.5 239.7  61.6
  9.|-- 72.14.223.0                0.0%    10   32.7  64.5  32.7 139.6  37.2
 10.|-- ???                       100.0    10    0.0   0.0   0.0   0.0   0.0
 11.|-- 8.8.8.8                    0.0%    10   48.3  66.4  35.2 155.6  44.6
Of course, you can combine the report or report-wide modes with other options, like -b for example:
$ mtr 8.8.8.8 -b -w
HOST: 21bb9ead214d          Loss%   Snt   Last   Avg  Best  Wrst StDev
  1.|-- _gateway (172.17.0.1)  0.0%    10    0.1   0.1   0.1   0.2   0.0
  2.|-- 192.168.43.1           0.0%    10    8.4   7.7   4.8  11.3   2.1
  3.|-- 10.235.0.1             0.0%    10  122.4  55.4  28.2 122.4  32.3
  4.|-- 192.168.66.130         0.0%    10  434.8  87.3  28.2 434.8 126.5
  5.|-- 213.3.229.78           0.0%    10  534.5  92.6  27.2 534.5 156.3
  6.|-- 213.3.229.13           0.0%    10  445.3  89.7  27.2 445.3 131.3
  7.|-- 213.3.229.6            0.0%    10  353.3  82.4  31.4 353.3 101.9
  8.|-- 138.187.129.143        0.0%    10  262.5  65.8  32.2 262.5  70.0
  9.|-- 72.14.223.0            0.0%    10  375.8  82.8  31.8 375.8 110.7
 10.|-- ???                   100.0    10    0.0   0.0   0.0   0.0   0.0
 11.|-- 8.8.8.8                0.0%    10  194.1  58.3  33.6 194.1  50.1
Send more packets
You can increase or decrease the number of packets in the report mode using the -c option. For example: mtr 8.8.8.8 -w -b -c 20
$ mtr 8.8.8.8 -w -b -c 20
HOST: 21bb9ead214d          Loss%   Snt   Last   Avg  Best  Wrst StDev
  1.|-- _gateway (172.17.0.1)  0.0%    20    0.1   0.1   0.1   0.2   0.0
  2.|-- 192.168.43.1           0.0%    20   76.2  26.3   4.8 152.6  38.5
  3.|-- 10.235.0.1             0.0%    20   32.6  74.7  31.7 153.3  45.2
  4.|-- 192.168.66.130         0.0%    20  132.4  58.6  26.2 144.1  37.4
  5.|-- 213.3.229.78           0.0%    20   89.4  92.0  29.6 290.6  70.7
  6.|-- 213.3.229.13           0.0%    20  155.0  94.0  30.9 201.9  53.6
  7.|-- 213.3.229.6            0.0%    20  106.9  91.2  23.7 208.5  62.0
  8.|-- 138.187.129.143        0.0%    20   37.4  93.7  33.0 235.7  62.7
  9.|-- 72.14.223.0            0.0%    20  133.3  73.7  28.9 164.7  47.0
 10.|-- ???                   100.0    20    0.0   0.0   0.0   0.0   0.0
 11.|-- 8.8.8.8                0.0%    20  160.9  80.3  30.3 185.4  55.8
Send packets faster
Now, let’s stress a bit more the network with a 50-packets test, with 0,1 second between the packets: mtr -c 20 -w -i 0.1 8.8.8.8
$ sudo mtr -c 20 -w -i 0.1 8.8.8.8
HOST: 21bb9ead214d    Loss%   Snt   Last   Avg  Best  Wrst StDev
  1.|-- _gateway        65.0%    20    0.1   0.1   0.1   0.2   0.0
  2.|-- 192.168.43.1    60.0%    20   65.5  15.4   5.2  65.5  20.3
  3.|-- 10.235.0.1       0.0%    20   90.4 108.2  28.1 247.6  61.3
  4.|-- 192.168.66.130   0.0%    20   81.5 112.8  24.0 280.4  69.3
  5.|-- 213.3.229.78     0.0%    20   72.7 106.3  30.8 229.2  60.9
  6.|-- 213.3.229.13     0.0%    20   63.5 118.7  24.5 363.8  90.8
  7.|-- 213.3.229.6      0.0%    20   54.4 107.2  28.3 252.3  67.6
  8.|-- 138.187.129.143  0.0%    20   45.2 102.2  31.9 243.5  64.9
  9.|-- 72.14.223.0      0.0%    20   36.0 104.5  33.7 336.0  81.8
 10.|-- ???             100.0    20    0.0   0.0   0.0   0.0   0.0
 11.|-- 8.8.8.8          0.0%    20   44.5 107.3  30.3 317.5  86.3
Note: you must have root privileges to use an interval lower than 1 second.
Change the fields of the report
To change the fields of the report or report-wide output, you can use the -o option and add the fields between quotation marks.
Here is a list of the fields (-o):
- L Loss ratio
- D Dropped packets
- R Received packets
- S Sent Packets
- N Newest RTT(ms)
- B Min/Best RTT(ms)
- A Average RTT(ms)
- W Max/Worst RTT(ms)
- V Standard Deviation
- G Geometric Mean
- J Current Jitter
- M Jitter Mean/Avg.
- X Worst Jitter
- I Interarrival Jitter
Let’s see an example below by adding the jitter values.
Using mtr for QoS debugging
mtr is not only a useful tool on the WAN but also on the LAN for example to control and troubleshoot QoS implementation.
Measure the jitter
As we saw in the previous example, we can add a different Jitter column to the output report:
$ sudo mtr -c 50 -n -w -i 0.1 -o "S L BAW MIX" 8.8.8.8
HOST: 21bb9ead214d      Snt  Loss%   Best   Avg  Wrst  Javg Jint Jmax
  1.|-- 172.17.0.1         50  78.0%    0.1   0.1   0.2   0.0  0.3  0.1
  2.|-- 192.168.43.1       50  80.0%    8.0  60.3 116.8  46.7 353. 108.8
  3.|-- 10.235.0.1         50   0.0%   22.4  82.7 185.5  59.1 944. 153.2
  4.|-- 192.168.66.130     50   0.0%   23.8  80.3 176.4  58.2 962. 152.0
  5.|-- 213.3.229.78       50   0.0%   22.7  77.8 175.9  53.7 968. 128.4
  6.|-- 213.3.229.13       50   0.0%   24.8  75.4 168.3  48.9 866. 125.0
  7.|-- 213.3.229.6        50   0.0%   23.1  84.2 209.4  50.6 809. 118.5
  8.|-- 138.187.129.143    50   0.0%   25.0  87.7 202.9  44.8 711. 112.0
  9.|-- 72.14.223.0        50   0.0%   25.9  85.0 196.6  42.6 672. 107.7
 10.|-- ???                50  100.0    0.0   0.0   0.0   0.0  0.0  0.0
 11.|-- 8.8.8.8            50   0.0%   24.6  92.1 213.4  58.8 774. 182.4
Using TCP or UDP instead of ICMP echo
A very interesting feature of mtr is the possibility to use UDP or TCP instead of ICMP. First because ICMP may be filtered, then also because ICMP packets are not processed the same in transit routers. For example, if we want to make statistics for voice traffic, we have to use the same port(s) and protocol as real voice packets, like this we see the results using the voice QoS.
The options are:
- -u use UDP instead of ICMP echo
- -T use TCP instead of ICMP echo
Let’s make a test on TCP port 443 for example:
# mtr -c 50 -n -w -T -P 443 83.166.138.59
HOST: 21bb9ead214d   Loss%   Snt   Last   Avg  Best  Wrst StDev
  1.|-- 172.17.0.1      0.0%    50    0.2   0.2   0.1   0.4   0.1
  2.|-- 192.168.43.1    0.0%    50   21.5  25.6   3.6 132.3  36.5
  3.|-- 10.235.0.1      0.0%    50  123.2  63.9  25.0 137.9  31.6
  4.|-- 192.168.66.130  0.0%    50  165.4  63.3  27.7 165.4  40.3
  5.|-- 213.3.225.174   0.0%    50   50.8  62.9  25.0 187.7  40.4
  6.|-- 83.166.138.59   0.0%    50   42.3  72.4  26.1 179.1  47.5
Set the type of service field
One more option to be able to test different QoS implementations into a network is to set the type of service field. This can be done with the option -Q.
Here is an example for voice packets, using UDP port 50000 with a ToS value of 184 (DSCP EF):
[root@21bb9ead214d /]# mtr -c 50 -n -w -u -P 50000 -Q 184 8.8.8.8
HOST: 21bb9ead214d    Loss%   Snt   Last   Avg  Best  Wrst StDev
  1.|-- 172.17.0.1       0.0%    50    0.1   0.1   0.0   0.3   0.1
  2.|-- 192.168.43.1     0.0%    50    6.8  21.0   3.8 122.3  26.8
  3.|-- 10.235.0.1       0.0%    50   82.2  52.1  27.7 180.6  30.4
  4.|-- 192.168.66.130  50.0%    50   56.6  46.9  25.4 139.3  27.1
  5.|-- 213.3.229.78    54.0%    50   34.7  51.9  23.4 173.1  36.2
  6.|-- 213.3.229.13    54.0%    50   29.8  52.7  23.2 144.8  36.5
  7.|-- 213.3.229.6     54.0%    50   93.9  58.6  23.7 158.9  41.6
  8.|-- 138.187.129.143 54.0%    50   65.5  46.1  22.9 115.2  23.6
  9.|-- 72.14.223.0     52.0%    50   73.0  53.4  27.4 194.1  39.5
 10.|-- ???             100.0    50    0.0   0.0   0.0   0.0   0.0
Unfortunately, I do not have a voice gateway to make real tests, and of course Google public DNS drop these UDP packets.
But, we can see on this Wireshark output that the QoS tagging is correct:

(click on the image to see it larger)
Extra: xml, json, csv, raw outputs
You can get the output of an mtr command in xml (-x), json (-j), csv (-C) or raw (-l) to use the results into a script or to export it into another tool.
By combining the port, the ToS tagging, and the XML output features, we can easily imagine a simple script that tests the performances of a LAN’s QoS for prioritized traffic.